
Experts in autocracies have pointed out that it is, unfortunately, easy to slip into normalizing the tyrant, hence it is important to hang on to outrage. These incidents which seem to call for the efforts of the Greek Furies (Erinyes) to come and deal with them will, I hope, help with that. As a reminder, though no one really knows how many there were supposed to be, the three names we have are Alecto, Megaera, and Tisiphone. These roughly translate as “unceasing,” “grudging,” and “vengeful destruction.”
All last year, and going into the year before. I did my best to keep us all updated on the 2020 Census – to participate, to encourage others to participate, to object to the Trump* regime’s obvious efforts to make the Census fail by forcing it to ask stupid questions and making it quittoo soon. It ended up stopping too early, but not as much to early as the regime wanted, andit ended up with 99% of all households countes. And, it has just released its projection that as of April 1, 2021, the total population of the US will be 332 million people.
Now – next year – comes redistricting. Each state does that for itself (I suppose that statement doesn’t exactly include states which end up woth only one district.) Each state has its own rules. Iowa, for instance, has rules about the shapes of the districts which tend to curb the worst of gerrymandering abuses. Ohio, Pennsylvania, not so much. Here’s an article on how redistricting can be fairly done.
================================================================
New electoral districts are coming – an old approach can show if they’re fair
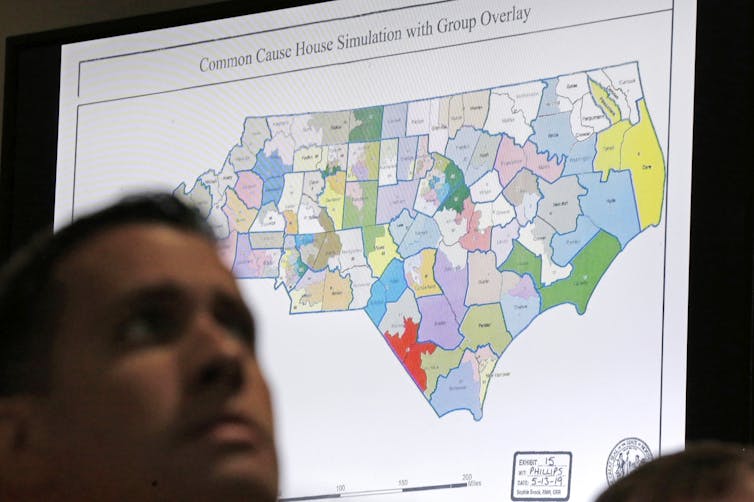
AP Photo/Gerry Broome
Jon X. Eguia, Michigan State University
When the results of the 2020 U.S. Census are released, states will use the figures to draw new electoral district maps for the U.S. House of Representatives and for state legislatures. This process has been controversial since the very early days of the nation – and continues to be so today.
Electoral district maps designate which people vote for which seat, based on where they live. Throughout history, these maps have often been drawn to give one party or another a political advantage, diluting the power of some people’s votes.
In the modern era, advanced math and computer algorithms are regularly used to analyze potential district boundaries, making it easier to spot these unfairnesses, called gerrymandering. But there is a simpler way – and it’s based on a system used early in the country’s history.
Before there were districts
In the very beginning of the U.S., there weren’t formal electoral districts. Instead, representation was based on counties and towns. For instance, under Pennsylvania’s 1776 state Constitution, each county, and the city of Philadelphia, was assigned a number of state assembly seats “in proportion to the number of taxable inhabitants.”
In 1789, the U.S. Constitution declared that seats in the U.S. House of Representatives would be allocated to the states in proportion to their populations. But it gave no guidance about how to fill those seats. Some states chose to draw an electoral district map, with each district getting one representative. Most of the others chose to grant the entire delegation to the party with the most votes statewide.
Through the first half of the 1800s, the rest of the states gradually shifted to drawing single-member electoral districts. The ideal was for each of these members – whether of Congress or a state legislature – to represent an equal number of people.
New census data, available every 10 years, was useful for doing this, but many states didn’t redraw their districts to adjust for population changes. As a result, newly developed regions with rapid population growth found themselves with less representation than more established population centers with slower growth.
It wasn’t until 1964 that the U.S. Supreme Court ruled that all states had to redraw their district boundaries for congressional and state elections, to guarantee that each member of a state delegation in a given assembly represented an equal number of people according to the latest census.
At that point, the controversy shifted from the number of people who lived in a district to its shape.
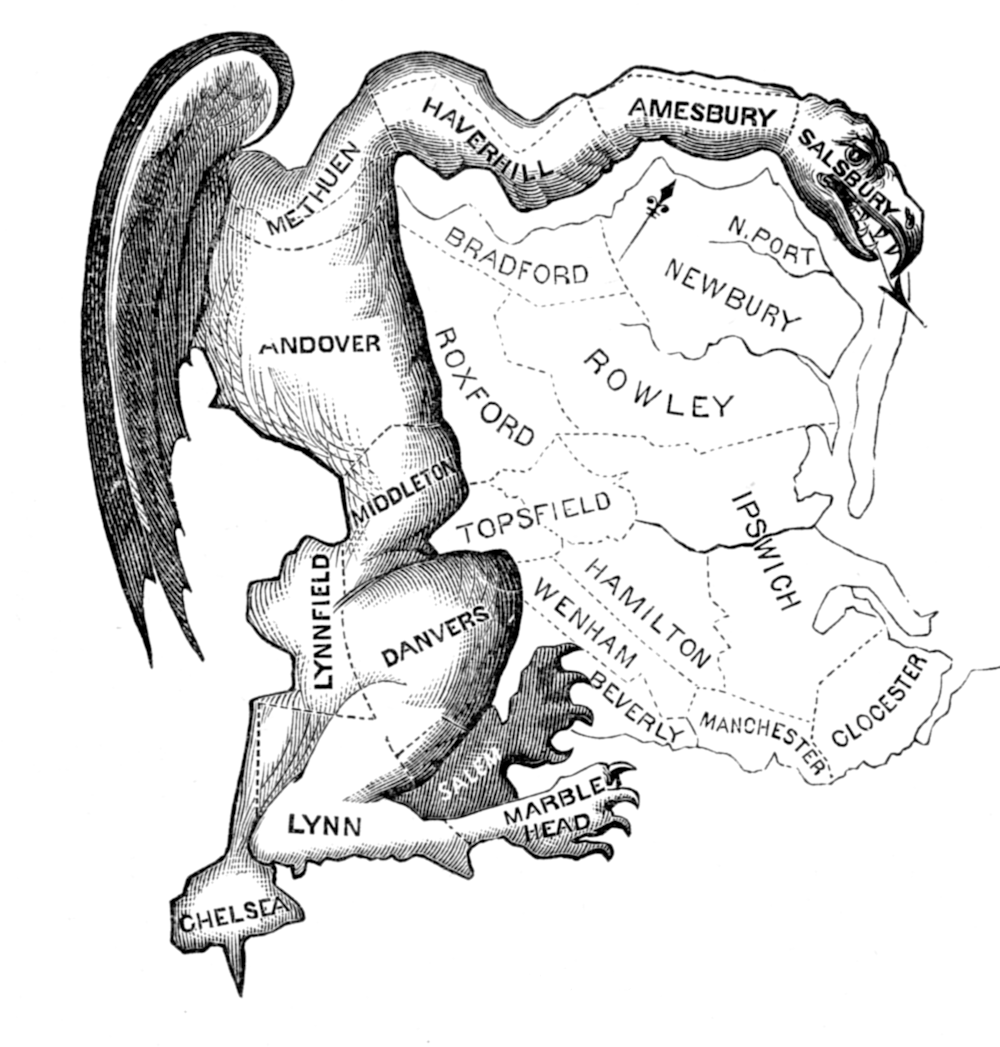
Elkanah Tisdale/Boston Centinel via Wikimedia Commons
Drawing the boundaries
An unfair map can favor one party over another by spreading out supporters across many districts and concentrating opponents in just a few. For instance, the 2018 North Carolina congressional elections saw Republican candidates win 50% of the votes statewide. But the Republicans had drawn the districts, so the party won 10 of the 13 seats. In the three districts Democrats won, they scored landslide victories. In the other 10 districts, Republicans won, but with smaller margins.
Maps aren’t necessarily unfair just because they deliver such lopsided results. Sometimes supporters of one party are already concentrated, as in cities. It’s possible for a fair map to deliver large Democratic wins in Philadelphia, Atlanta, Detroit or Milwaukee while the party gets only half the statewide votes in Pennsylvania, Georgia, Michigan or Wisconsin.
Comparison with alternatives
What I consider a better way to analyze a redistricting map for fairness is to compare it with other potential maps.
Making this comparison doesn’t require knowing how individual people voted. Rather, it involves looking at the smallest units of vote tabulation: precincts, which are sometimes also called wards. Each of these has somewhere between a few hundred and a couple thousand voters; larger districts are made by putting together groups of precincts.
Computers can really help, creating large numbers of alternate maps by assembling precincts in different combinations. Then the vote totals from those precincts are added up, to determine who would have won the newly drawn districts. Those alternate results can shed light on whether the real map was fair.
For instance, in the 2012 congressional elections in Pennsylvania, Republican candidates got fewer votes than Democrats, but Republicans won 13 of the state’s seats, while Democrats won only five. Researchers created 500 alternative maps, and showed that Republicans would win eight, nine or 10 seats in most of those maps, and never more than 11 seats. After seeing that evidence, the Pennsylvania Supreme Court found that the map violated the state Constitution’s standards for free and equal elections. Justices tossed out the map and ordered a new one drawn in time for the 2018 election.
Easily evaluating fairness
A simpler way to evaluate newly drawn districts is to imagine going back to assigning seats the way Pennsylvania did in 1776: The party winning the vote in each county or large town got seats in proportion to the location’s population.
Comparing the county-by-county results with the results based on a particular district map will show whether there is a major difference between the imaginary and the real results. If so, that signals an unfair partisan advantage.
For instance, North Carolina has 100 counties. In the 2018 U.S. House election, Republican candidates got more votes than Democratic candidates in 72 of them, which together are home to 51% of the state’s population. Under the 1776 Pennsylvania system, the Republican Party deserved 51% of the seats – or 6.6 out of 13. Allowing for rounding, it’s reasonable for Republicans to win six or seven seats – or perhaps even eight – but more than that is an unfair and artificial partisan advantage.
Under the map in use in 2018, North Carolina Republicans won 10 seats. The state Supreme Court later threw out that map, which was replaced by one in which Republicans won eight seats in 2020.
To be very clear, I’m not proposing actually returning to the old Pennsylvania method of assigning seats. Rather, I’m proposing that its potential outcomes be used to evaluate maps of electoral districts drawn with equal populations. If the results are similar, then the map is likely relatively fair.
This measure of partisan advantage is much simpler to compute than making large numbers of alternative maps. I did the calculations for 41 states, using the results of the 2012, 2014, 2016 and 2018 congressional elections. I compared those election outcomes with the results that would have happened if seats were assigned by counties and major towns or cities.
[Deep knowledge, daily. Sign up for The Conversation’s newsletter.]
I found that on average across these four elections, and on aggregate across all these 41 states, the 2012-2018 maps gave an advantage of 17 seats in the House of Representatives to the Republican Party. The five states with the most unfair advantages relative to their total delegation size are North Carolina, Utah, Michigan and Ohio – favoring Republicans – and Maryland, favoring Democrats.
Auspiciously, court rulings and citizen ballot initiatives in the past five years have led to redistricting reform in four of these states. Continued civic engagement can help to induce mapmakers in these and other states to draw redistricting maps that guarantee fairer representation for the 2022-2030 cycle.![]()
Jon X. Eguia, Professor of Economics, Michigan State University
This article is republished from The Conversation under a Creative Commons license. Read the original article.
================================================================
Alecto, Megaera, and Tisiphone, this shows why it is so important for us to concern ourselves with gubernatorial elections, and most particularly in the last election before the redistricting is done. These are usually years ending in 8 or 0, though I believe a few states use odd years. But it’s not hard to figure for any given state. y state, Colorado, in 2018, overwhelmingly approved a ballot measure establishing an independent commission with no veto possible by the governor to draw our districts. It will be interesting to see what happens. But only 7 states have independent commissions. Ballotpedia makes it very easy to find how your state does this. Thirty-four states leave it to the state legislatures (which means the Governor has veto power). Seven have only one district anyway. The remaining two have commissions made up of politicians (which certainly doesn’t sound good.)
The Furies and I will be back.

12 Responses to “Everyday Erinyes #245”
Sorry, the comment form is closed at this time.
Elbridge Gerry left us with a legacy of unfairly drawn districts, and it is way beyond time to straighten out this situation, pun noted.
Rachel Maddow did a complete show on gerrymandering, as has John Oliver, she concentrated primarily on Pennsylvania and Ohio, showing just how insanely republicans will draw districts to give themselves advantages. In Minnesota the legislature is supposed to do it by a date certain, if not, then it falls to our Supreme Court, who do a relatively good job of it. I’m not entirely sure how that process works in other states but gerrymandering has been approved by the U.S. Supreme Court, sort of with a wink, as long as it doesn’t have the effect of disenfranchising people. But it does now, that original precedent is very old and given the current makeup of the Court unlikely to be changed. We’ll need to overwhelm politics with new, diverse voters who are coming of age now, but it will be the next census before they can have the effect their numbers deserve. That doesn’t mean progressive ideas won’t and can’t prevail, only that the entrenched republicans are going to be problemmatic longer than their dying party deserves.
Pennsylvania and Ohio are notorious, but not alone. Not surprising they’ve been used as examples by – well, just about everyone.
Very well done JD. I think redistricting should be cone by computer to find the mix that most fairly represents population.
In CA, the GOP was behind the independent commission to draw the districts, expecting they’d get more districts and when they didn’t see that, the challenged in court and lost. The last legislative districts, controlled by DEMs, were designed to preserve all incumbants of either party–so I have a Congressional district favoring the GOP that includes parts of way too many counties in order to avoid including any part of a neighboring urban county with massive DEM voters compared to GOP.
Breathed a sigh of relief, for the moment, on SCOTUS and the proposal to exclude noncitizens for redistricting. The relief is that they see, with the problems the Census bureau has had, that reporting may not happen until the next administration and, perhaps, no one finished defining what groups to exclude that anyone actually had numbers they might use.
Thanks Joanne–apparently there are some decent criteria being used by states that Congress could use in legislation to minimize gerrymandering nationwide.
If I understand the issue correctly, gerrymandering would be less of an issue if Americans didn’t have to register to vote and didn’t have to proclaim to which party they ‘belong’. Every one falling within the definition of a voter (here that is citizenship, older than 18 and that’s it) has the right to vote, but what you vote for is nobody’s business, not even of a census.
So if the voting districts would be drawn on voting populations only and drawn by independent agencies not interested in the spread of votes in years before, not much gerrymandering can occur. If other countries can do it, America certainly should be able to if all parties are willing. But that’s the crux, isn’t it?
Appendages crossed!
Educational and informative.
Thank you, Joanne for this very interesting post.
I read this partially yesterday, but my Wifi went out.
I’ve been signing petitions for many years about doing away with the Electoral College, ever since tRump was voted in 2016.
Hopefully they can get rid of the gerrymandering issues that’s been happening way too long.
Thanks Joanne
Many people believe we will never be able to do away with the Electoral Colloege. I believe that it can be done, but that it cannot be done before the National Popular Vote Compact has been adopted by enough states to make the popular vote secceed every time – and further, until that has been in effect for long ehough for people to see that it works, and works well. After all that happens, we (well, not really “we,” because I certainly won’t be around, and many of us also will not) can work on abolishing the electoral college.
fairness would be nice….but not holding my breath